Time-walk Correction: Matrix
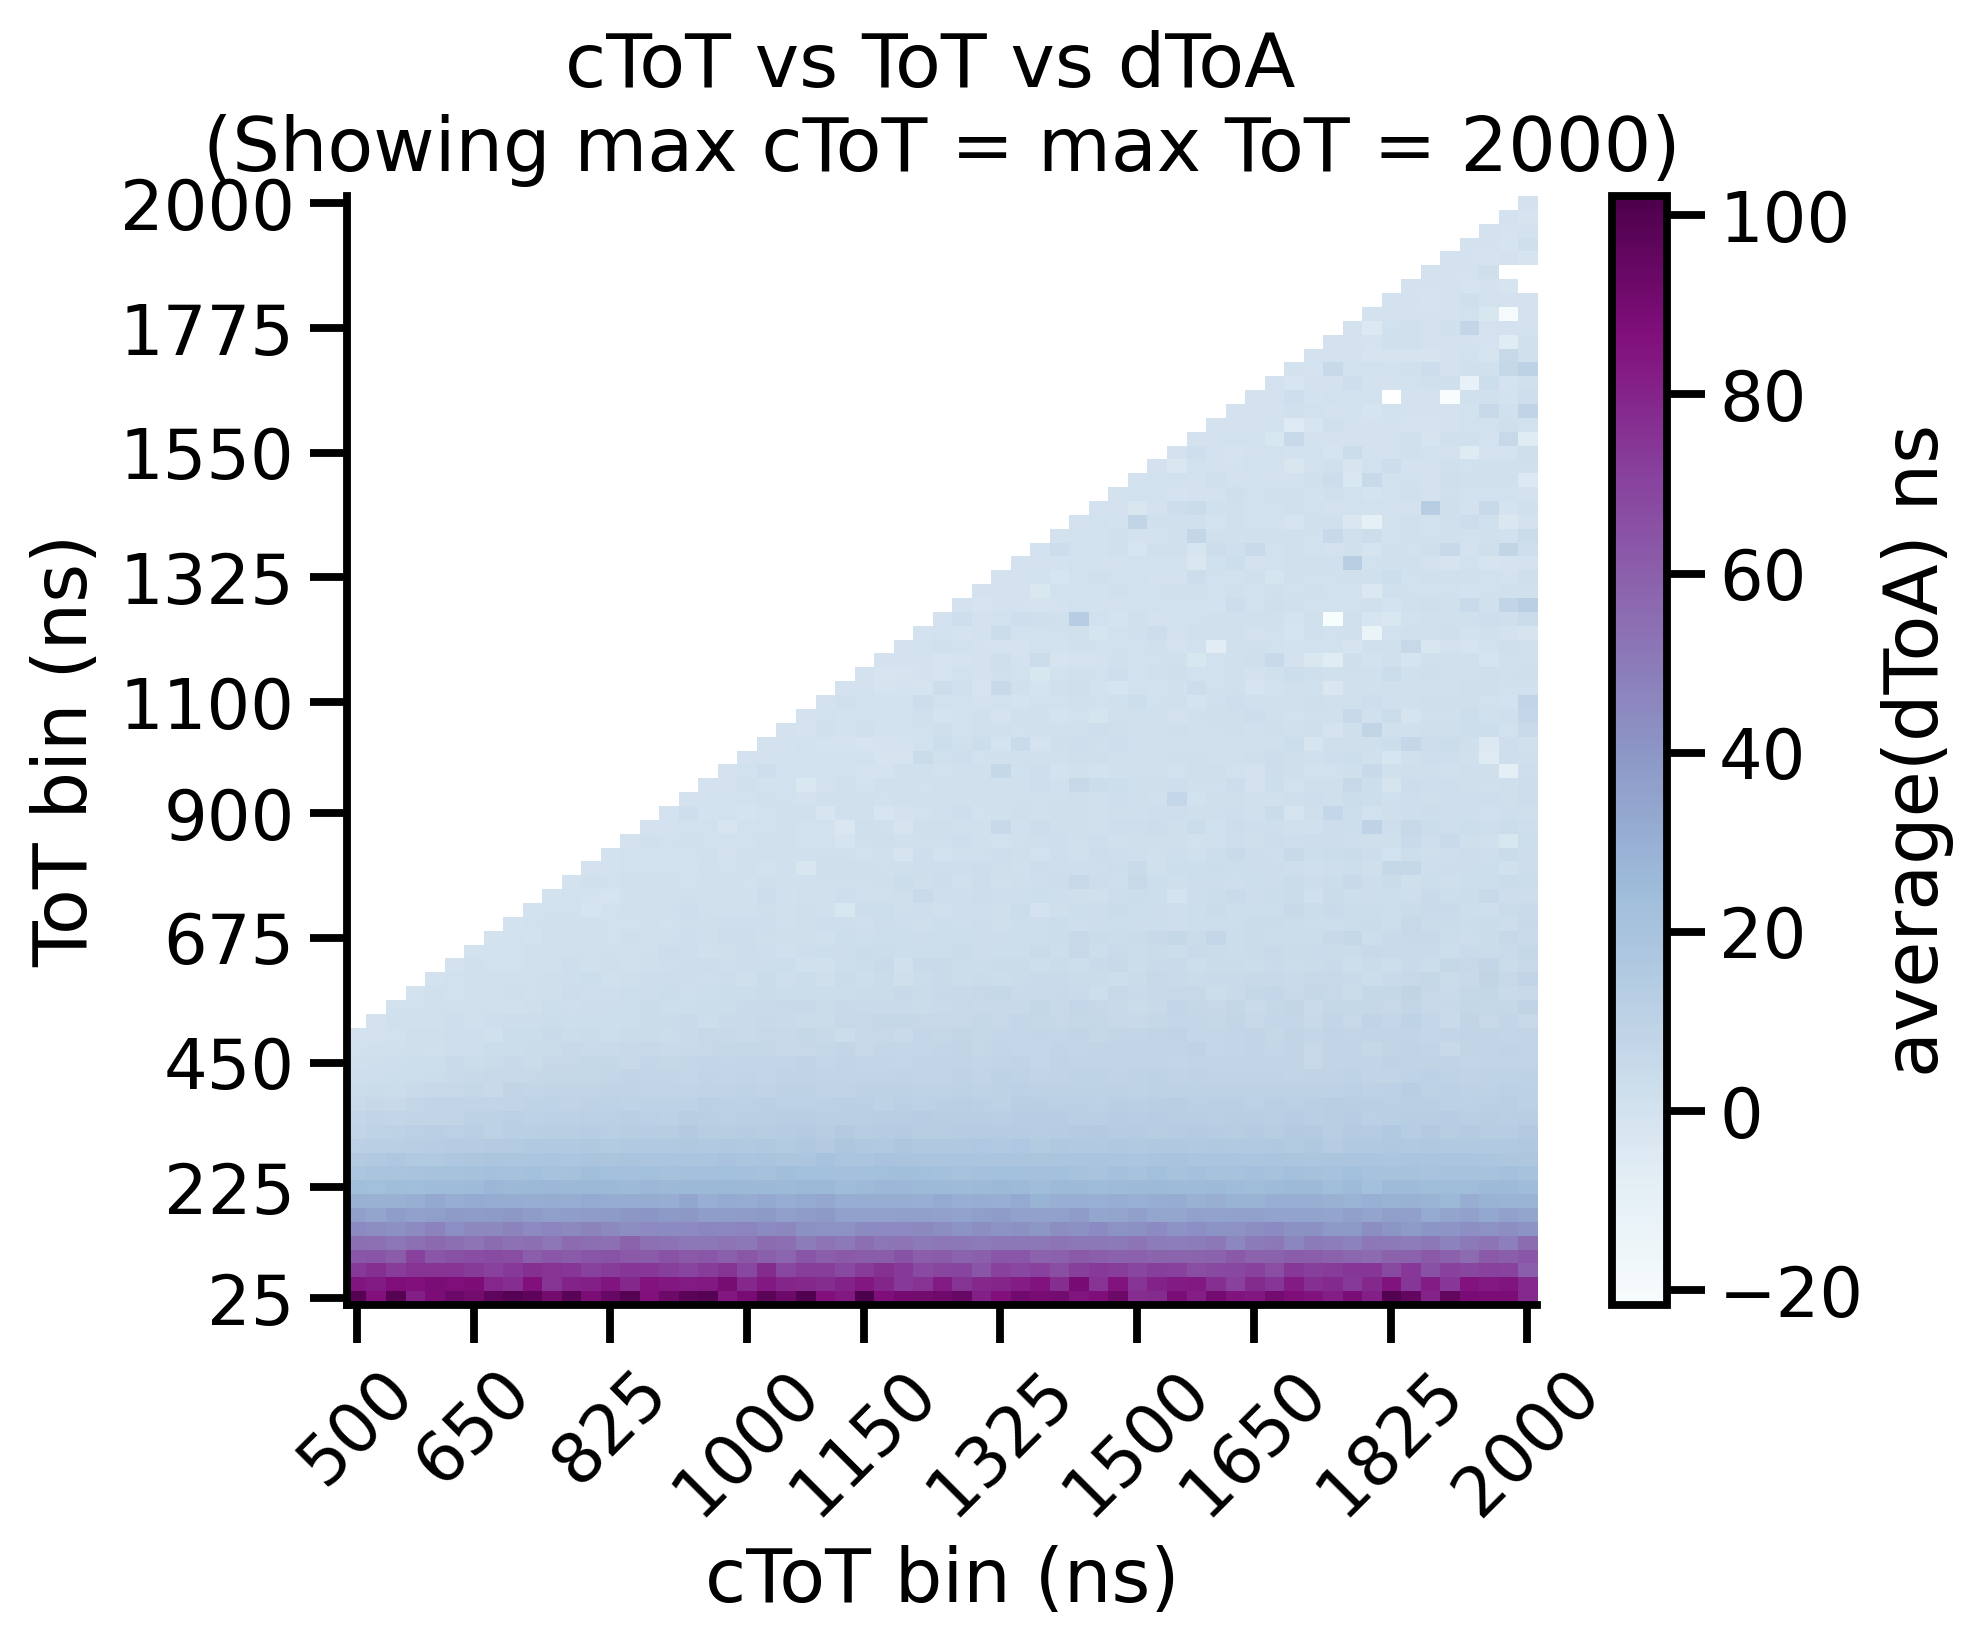
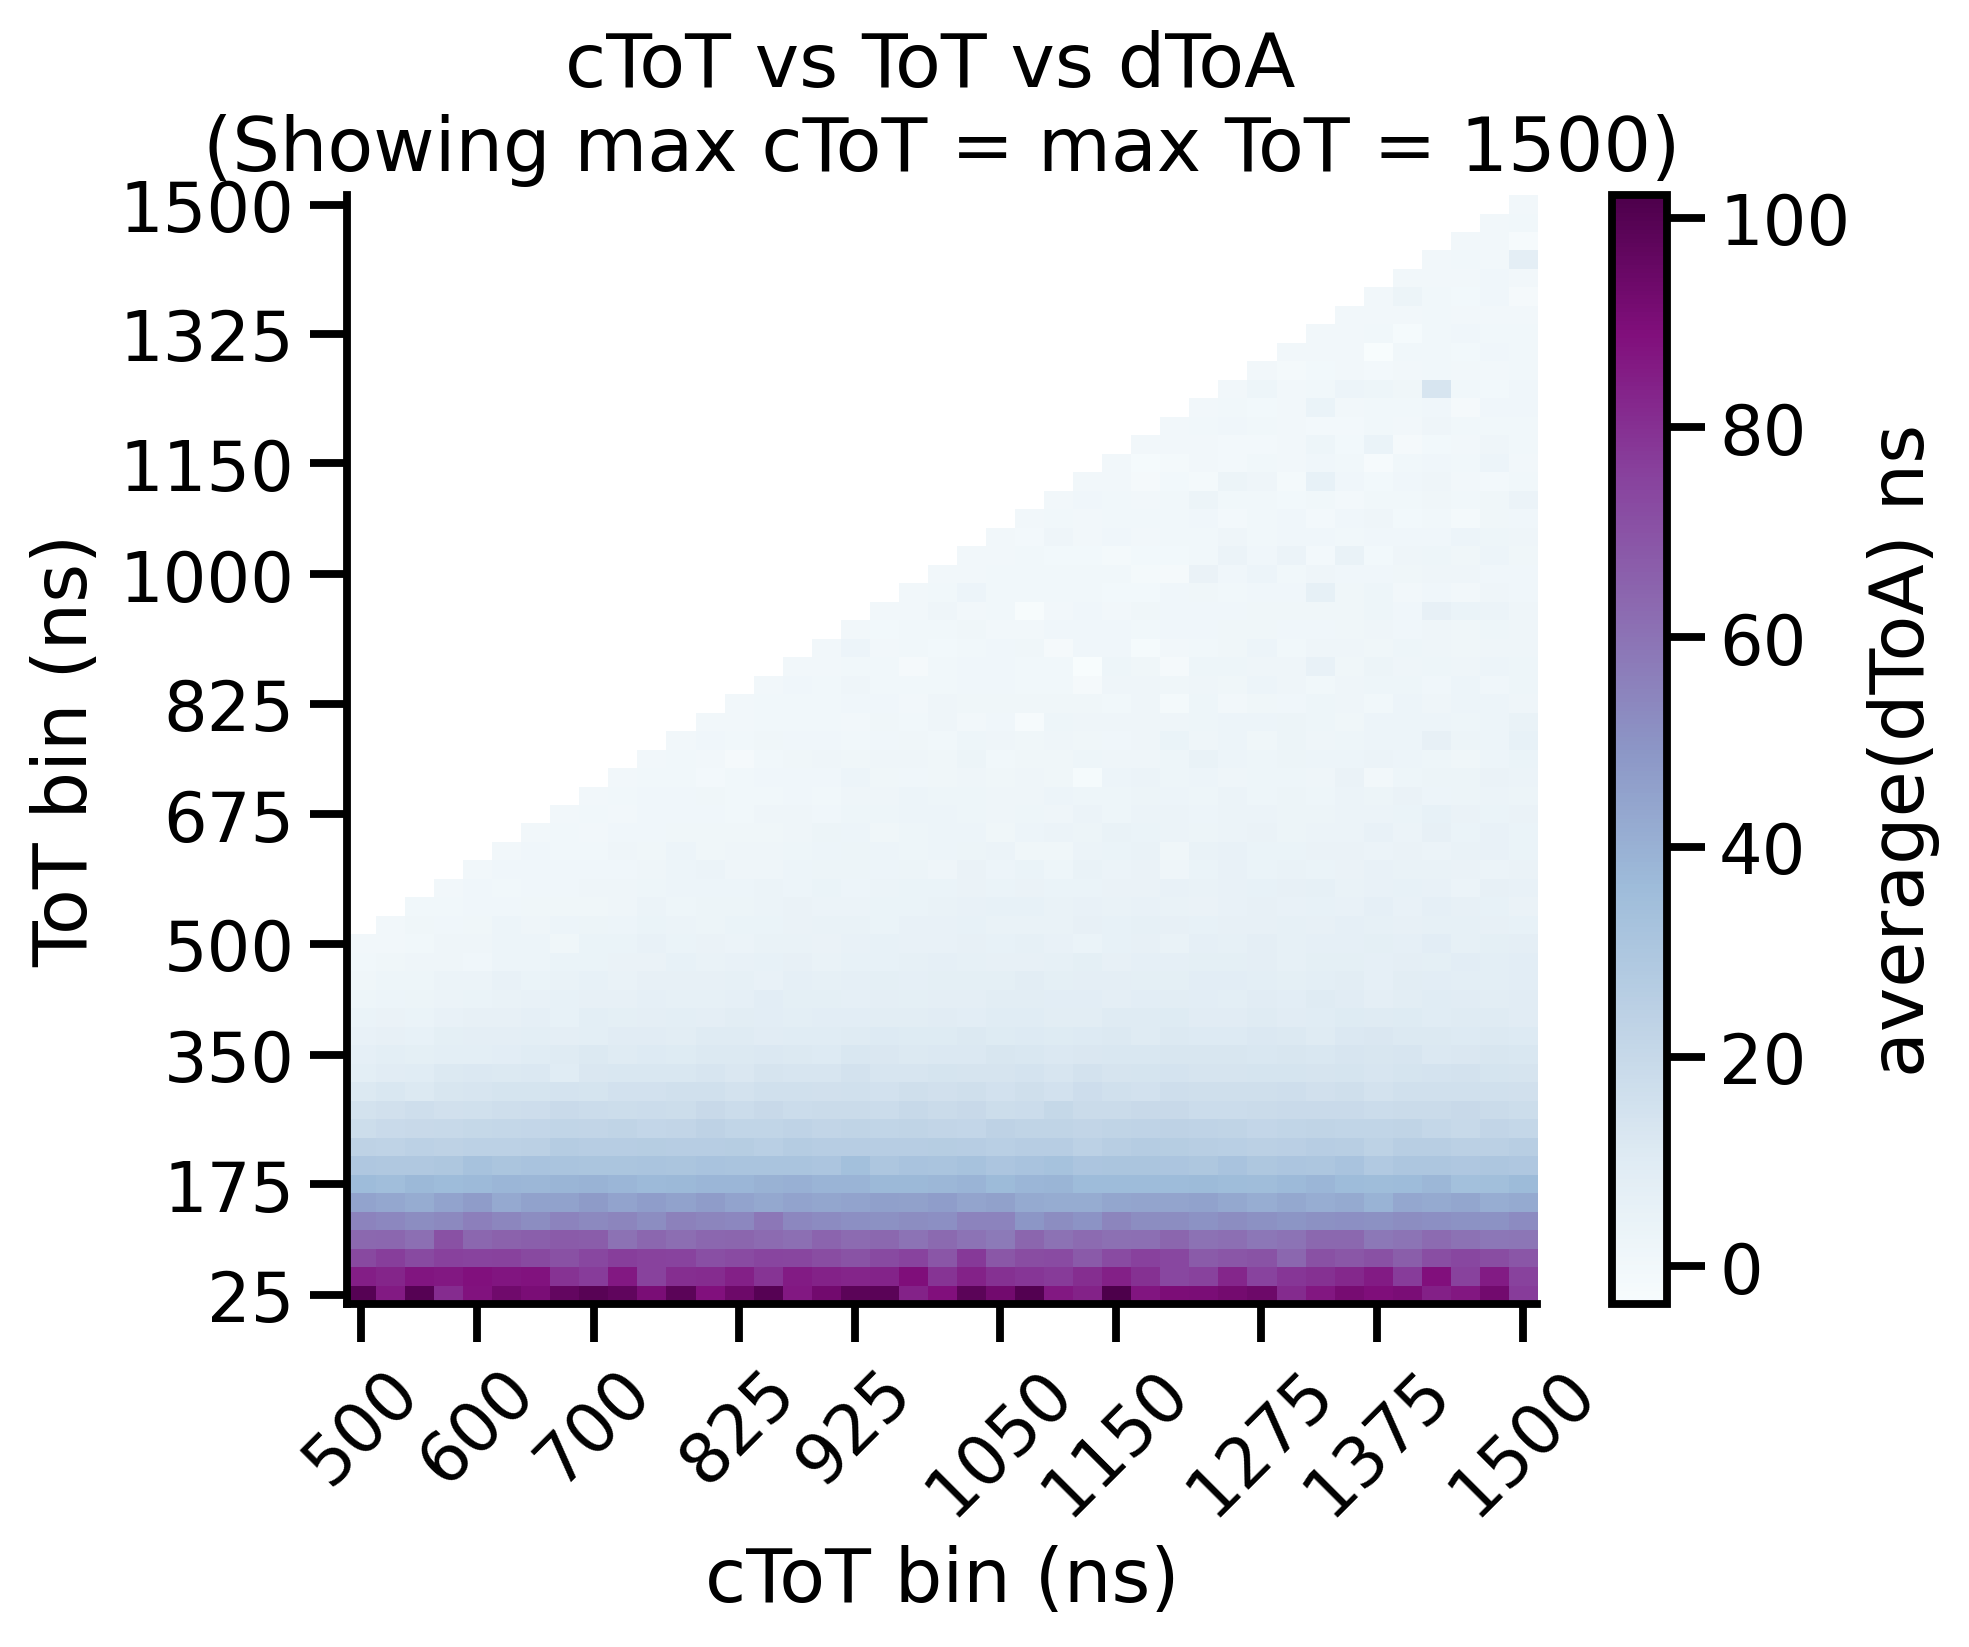
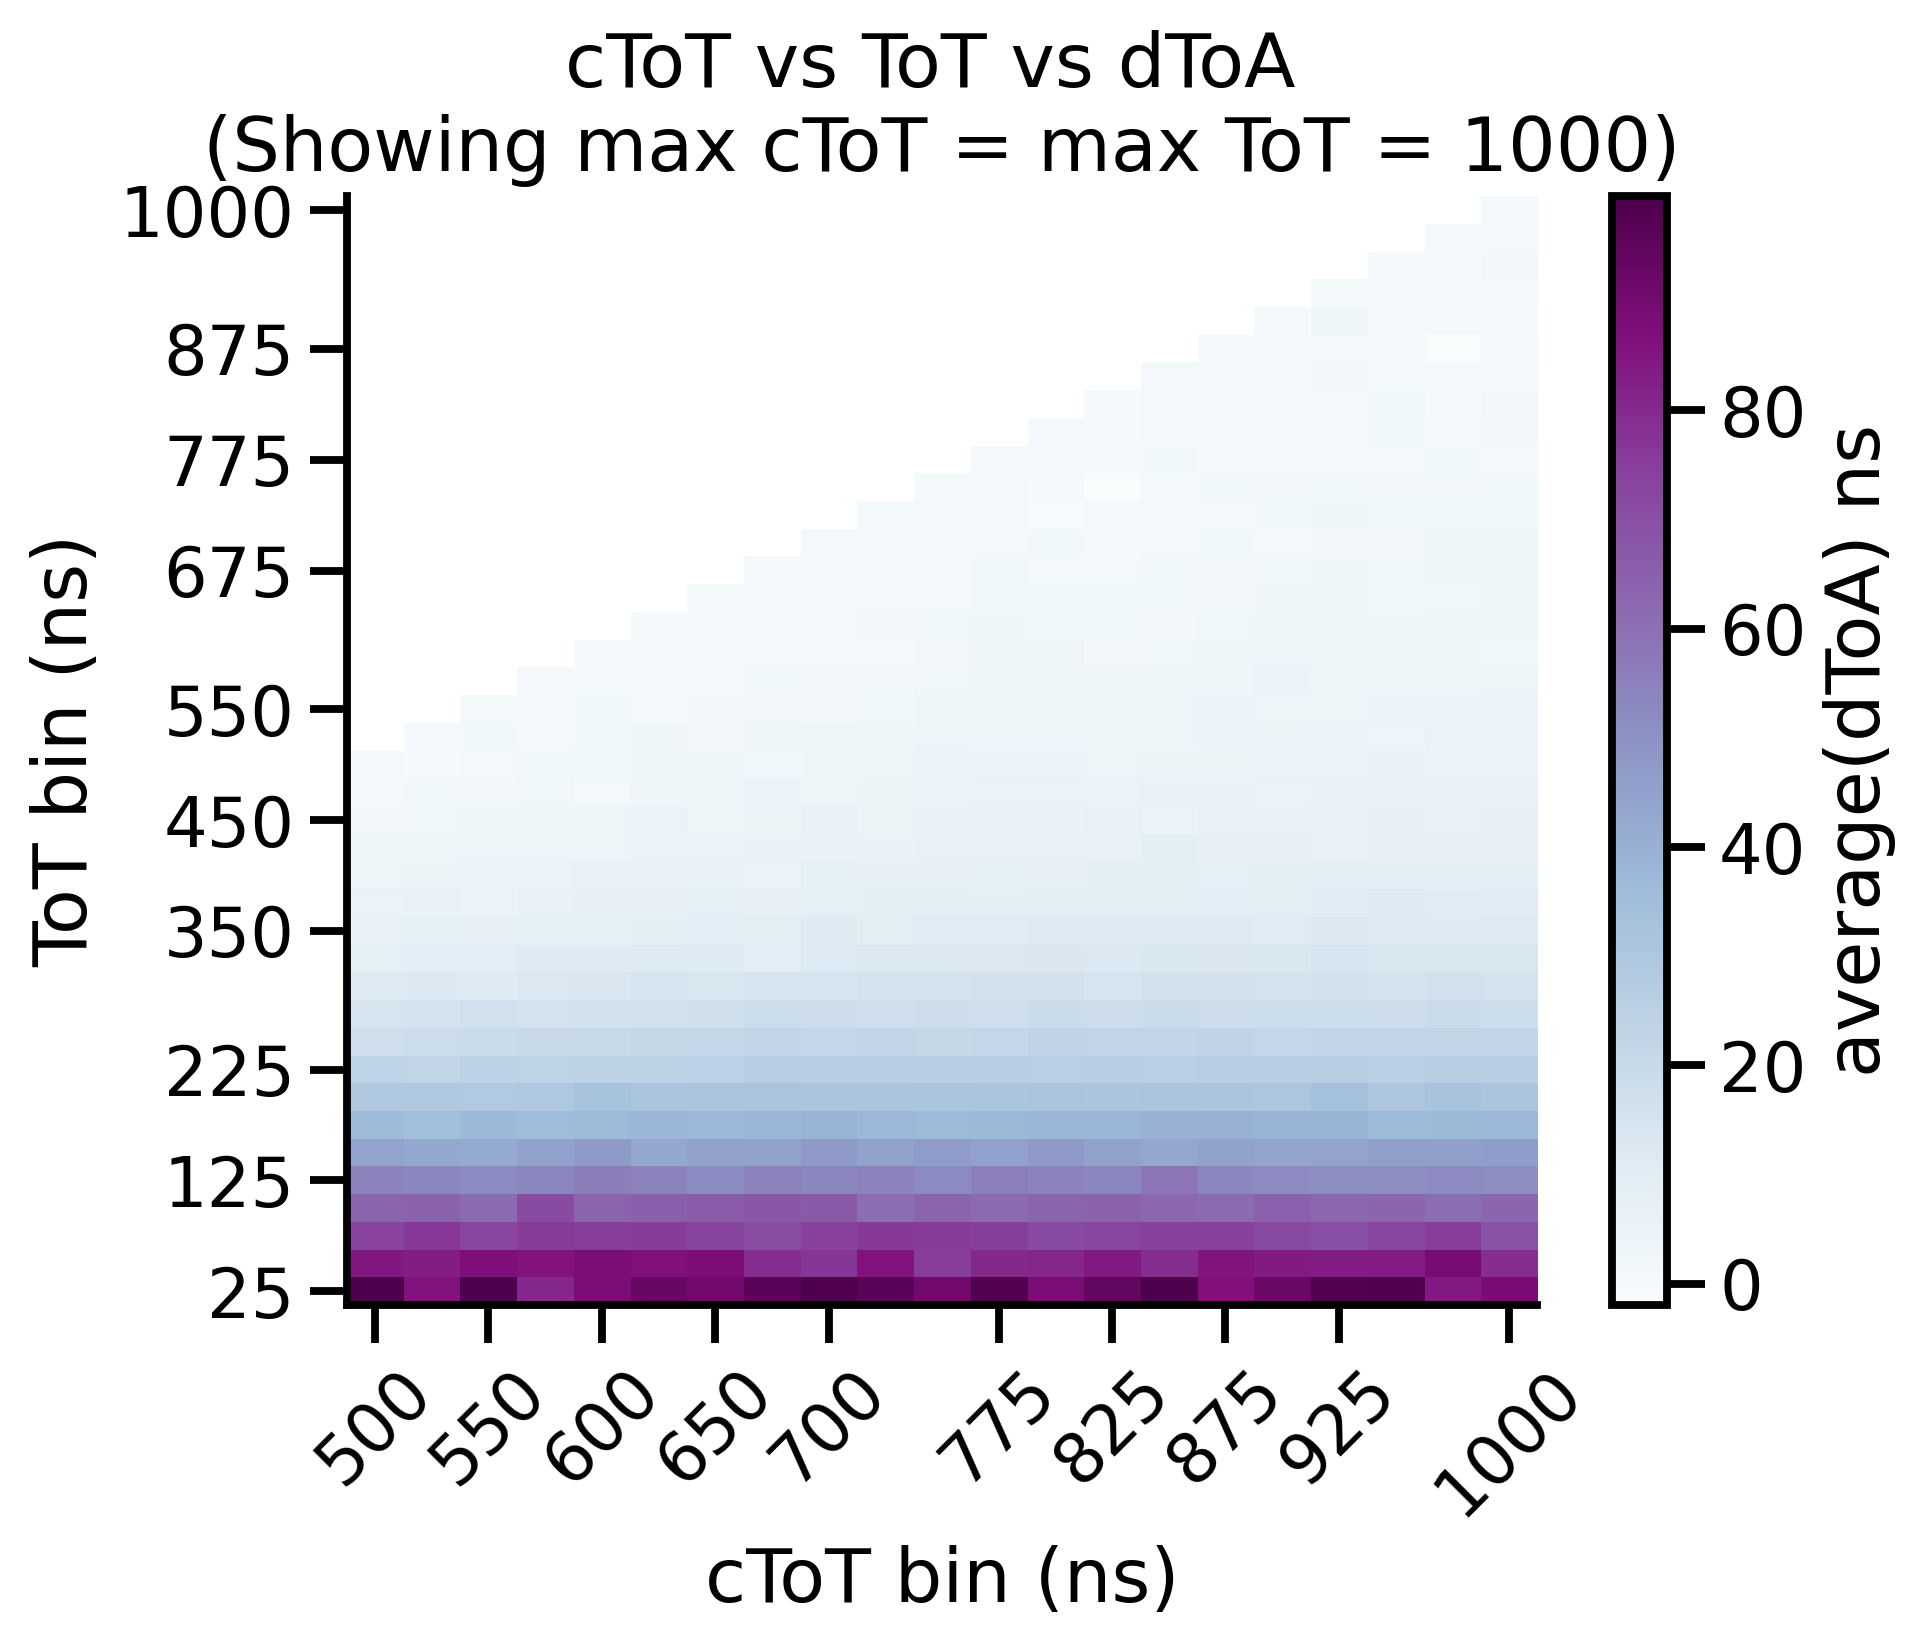
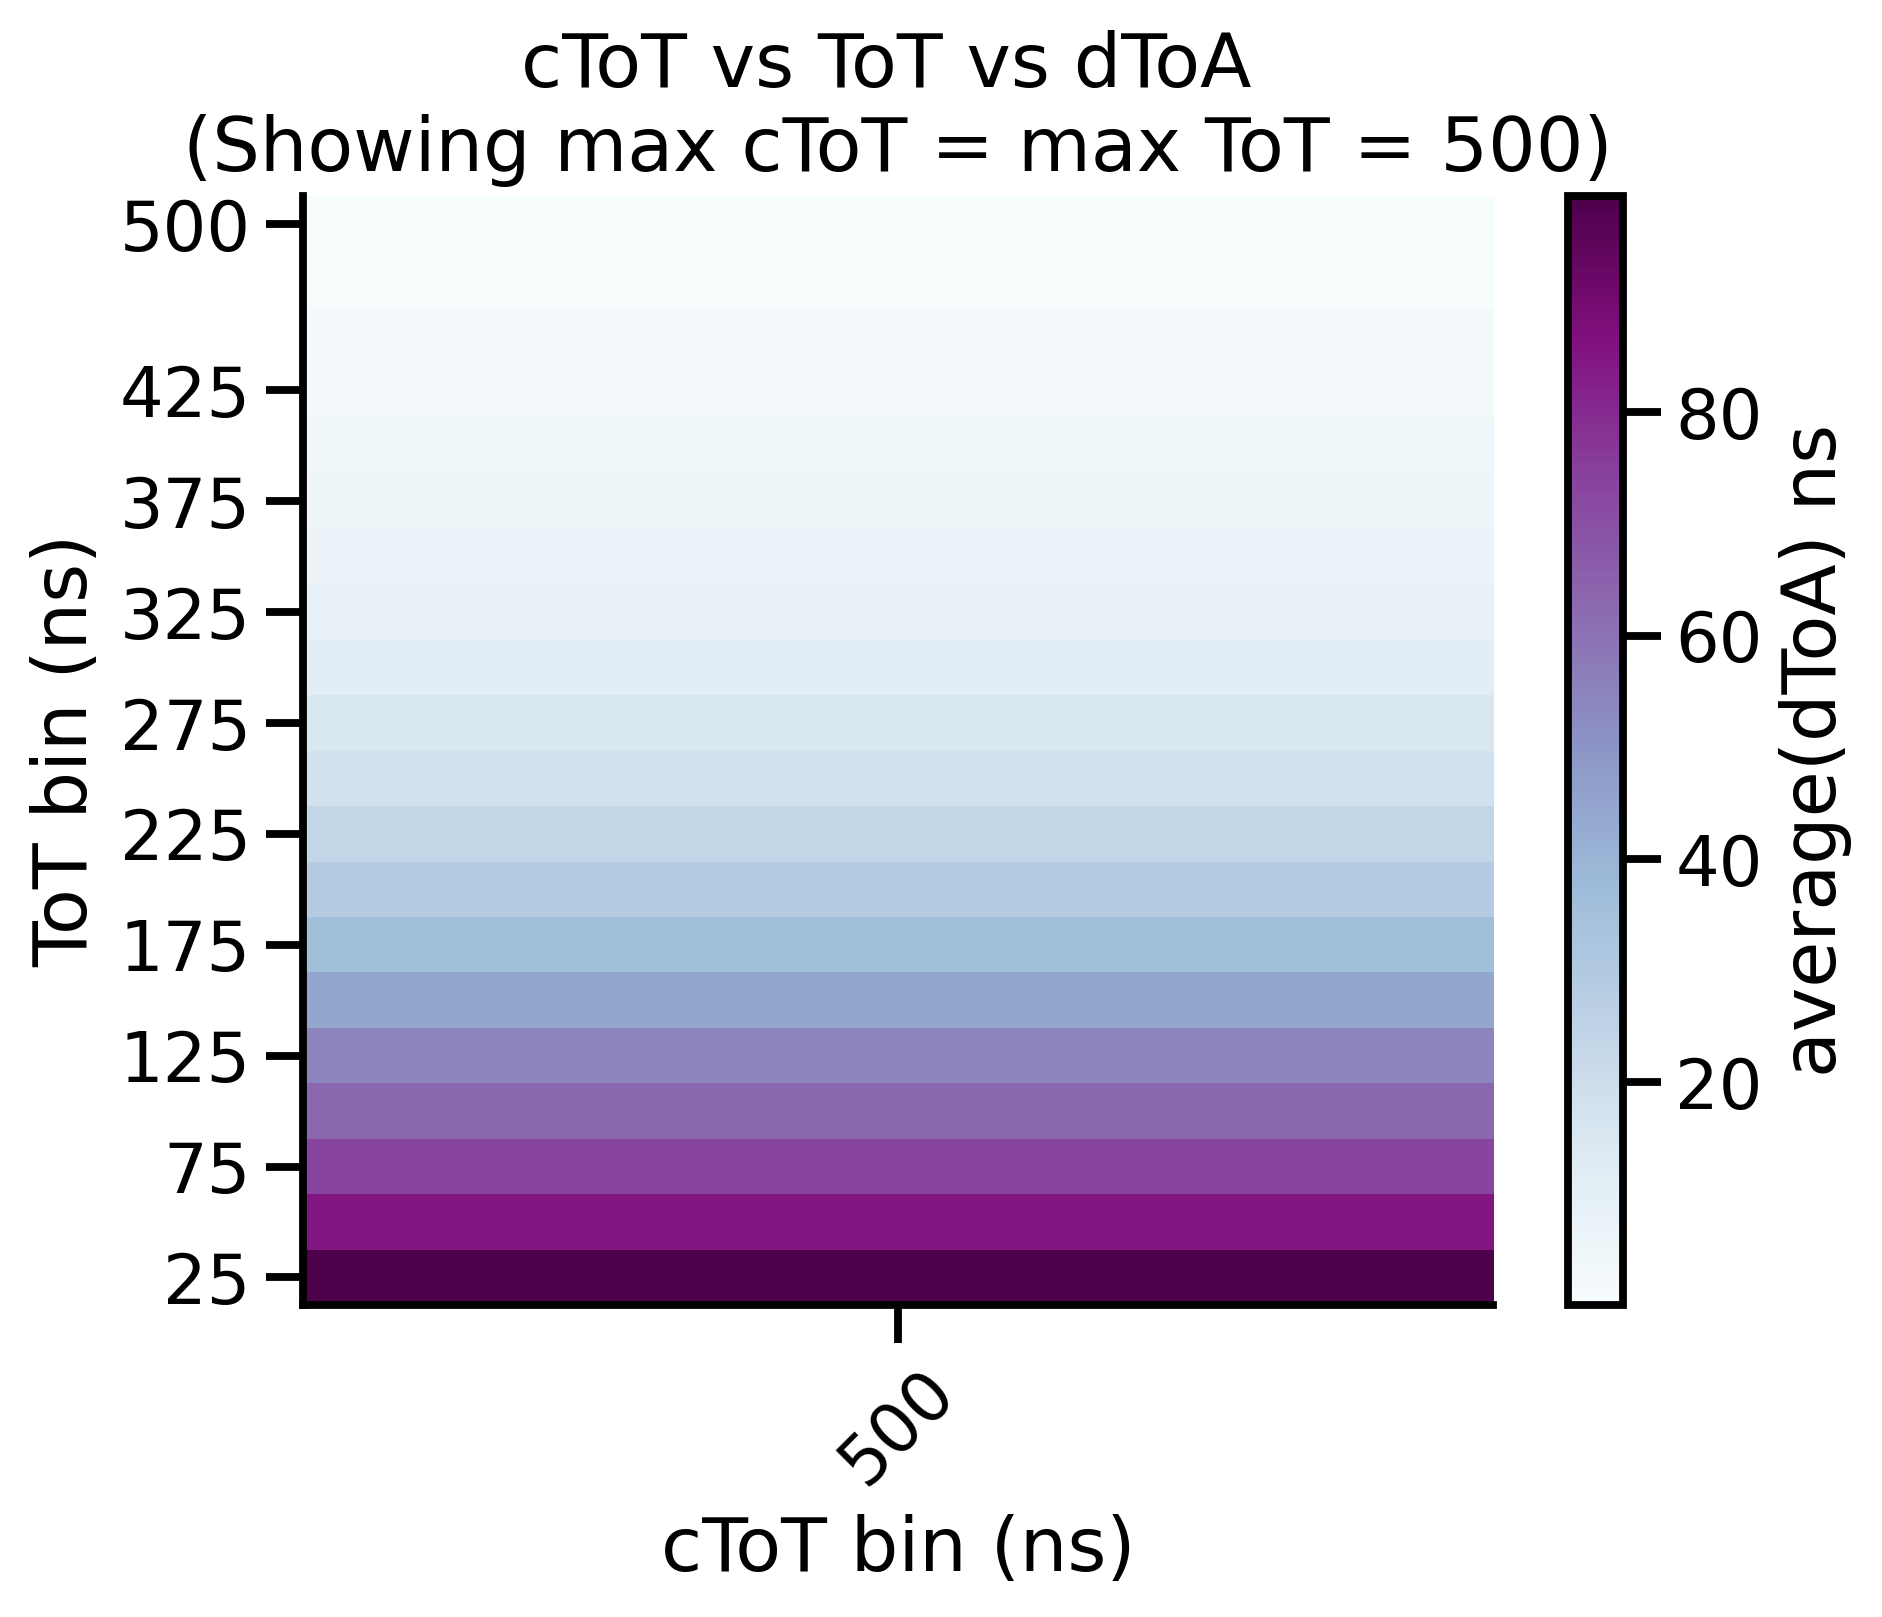
The timewalk matrix gives important insight into your data. More specifically it shows you where to put the cToT cut parameter. The timewalk lookup table is an average of this matrix, “cut” at a particular cToT point. That is, values lower than this are discarded and values higher are averaged and used to construct the lookup table.
Luna Command
tpx3dump process -i /Users/Ciaran/atlassian-bitbucket-pipelines-runner/temp/e71169e4-520a-5b30-a5ab-ee8a44eb5fac/build/docs/source/_static/example_data.tpx3 -o /Users/Ciaran/atlassian-bitbucket-pipelines-runner/temp/e71169e4-520a-5b30-a5ab-ee8a44eb5fac/build/docs/source/_static/example_data.hdf5 --eps-t 150ns --eps-s 1 --ctot-cut 500
Python Script
Plot the timewalk matrix
  1import os, sys
  2from typing import *
  3import lmfit
  4import pandas as pd  # ensure you have `pip install pandas`
  5import warnings
  6import seaborn as sns
  7import matplotlib.pyplot as plt
  8from matplotlib import cm
  9from matplotlib.colors import Normalize
 10import numpy as np
 11
 12
 13warnings.filterwarnings("ignore")  # suppress warnings from plotting libraries.
 14
 15sns.set_context(context="talk")
 16
 17# add some paths to PYTHONPATH
 18for directory in ["..", "."]:
 19    sys.path.append(os.path.abspath(os.path.join(os.path.dirname(__file__), directory)))
 20
 21# on our system "EXAMPLE_DATA_HDF5" refers to the absolute path
 22# to a hdf5 file generated by luna. Replace with your own!
 23from env_vars_for_docs_examples import EXAMPLE_DATA_HDF5, PLOTS_DIRECTORY
 24
 25# re-use functions from previous example
 26from ex2_read_data_time_units import load_timewalk_matrix, TimeUnit
 27
 28
 29def plot_timewalk_matrix_heatmap(timewalk_matrix: pd.DataFrame, max_ctot_and_tot_to_show: Optional[List[int]] = None):
 30    """
 31    Plots a heatmap of the timewalk matrix.
 32
 33    This function generates and saves heatmaps of the timewalk matrix, showing the relationship between
 34    CToT (Corrected Time over Threshold) and ToT (Time over Threshold) bins, and their corresponding
 35    AverageDToA (Average Delta Time of Arrival) values. The heatmaps are saved as PNG files.
 36
 37    Parameters:
 38    -----------
 39    timewalk_matrix : pd.DataFrame
 40        A DataFrame containing the timewalk matrix data. The DataFrame should have the following columns:
 41        - 'CToT': Corrected Time over Threshold
 42        - 'ToT': Time over Threshold
 43        - 'AverageDToA': Average Delta Time of Arrival
 44        - Other columns may include 'SumSquareDiff', 'Count', 'Std', 'Sem', etc.
 45
 46    max_ctot_and_tot_to_show : Optional[List[int]], default=None
 47        A list of integers specifying the maximum CToT and ToT values to show in the heatmap. If None,
 48        the default value [1024 * 25] is used. Each value in the list will generate a separate heatmap.
 49
 50    Returns:
 51    --------
 52    None
 53        The function does not return any value. It saves the generated heatmaps as PNG files in the
 54        specified directory.
 55
 56    Raises:
 57    -------
 58    AssertionError
 59        If `max_ctot_and_tot_to_show` is not a list of integers.
 60
 61    """
 62    if max_ctot_and_tot_to_show is None:
 63        max_ctot_and_tot_to_show = [1024 * 25]
 64
 65    for max_tot in max_ctot_and_tot_to_show:
 66        assert isinstance(max_ctot_and_tot_to_show, list), "max_ctot_and_tot_to_show should be a list of integers"
 67
 68        timewalk_matrix_avg = timewalk_matrix.pivot(index="ToT", columns="CToT", values="AverageDToA")
 69        print(timewalk_matrix_avg.head())
 70        data = timewalk_matrix_avg.loc[timewalk_matrix_avg.index <= max_tot, timewalk_matrix_avg.columns <= max_tot]
 71
 72        fig, ax = plt.subplots()
 73        sns.despine(fig=fig)
 74        img = ax.imshow(data.values,
 75                        origin="lower",
 76                        cmap="BuPu",
 77                        aspect="auto",
 78                        )
 79        ax.set_ylabel("ToT bin (ns)")
 80        ax.set_xlabel("cToT bin (ns)")
 81
 82        xticks = np.linspace(0, data.shape[1] - 1, num=min(10, data.shape[1]), dtype=int)
 83        yticks = np.linspace(0, data.shape[0] - 1, num=min(10, data.shape[0]), dtype=int)
 84
 85        ax.set_xticks(xticks)
 86        ax.set_yticks(yticks)
 87        ax.set_xticklabels(data.columns[xticks], rotation=45)
 88        ax.set_yticklabels(data.index[yticks])
 89
 90        c = plt.colorbar(img)
 91        c.set_label('average(dToA) ns')
 92        plt.title(f"cToT vs ToT vs dToA \n(Showing max cToT = max ToT = {max_tot})")
 93        fname = os.path.join(PLOTS_DIRECTORY, f"ex8_timewalk_matrix_heatmap_{max_tot}.png")
 94        plt.savefig(fname, bbox_inches='tight', dpi=300)
 95
 96
 97
 98if __name__ == "__main__":
 99    toa_unit = TimeUnit.Nanoseconds
100
101    timewalk_matrix = load_timewalk_matrix(EXAMPLE_DATA_HDF5, toa_unit=toa_unit)
102    print("Timewalk Matrix:")
103    print(timewalk_matrix.head().to_string())
104    if timewalk_matrix is not None:
105        tot_thresholds = [ 500, 1000, 1500, 2000]
106        plot_timewalk_matrix_heatmap(timewalk_matrix, tot_thresholds)
Script Output
Example Output
<KeysViewHDF5 ['Clusters', 'ExposureTimeBoundaries', 'PixelHits', 'TimewalkLookupTable', 'TimewalkMatrix']>
Timewalk Matrix:
   CToT  ToT  AverageDToA  SumSquareDiff  Count        Std       Sem
0   500   25    99.356621     94192336.0     17  23.538746  5.708984
1   500   50    84.650749     80431408.0     17  21.751457  5.275504
2   500   75    73.153412     76722296.0     44  13.204880  1.990710
3   500  100    63.130474    104241200.0     57  13.523288  1.791203
4   500  125    54.665501    144652992.0     71  14.273634  1.693969
CToT       500        525        550   ...       6675       6825       6850
ToT                                    ...
25    99.356621  85.677086  99.588829  ...        NaN  23.437500  20.833334
50    84.650749  83.046875  86.979172  ...  14.062500  18.750000  20.312500
75    73.153412  76.286766  72.593735  ...  14.062500  16.406252  13.541668
100   63.130474  63.586956  60.998768  ...  13.020833   7.812500   8.593750
125   54.665501  53.568096  51.769302  ...  12.500001        NaN  11.328125

[5 rows x 189 columns]