Plotting Distributions
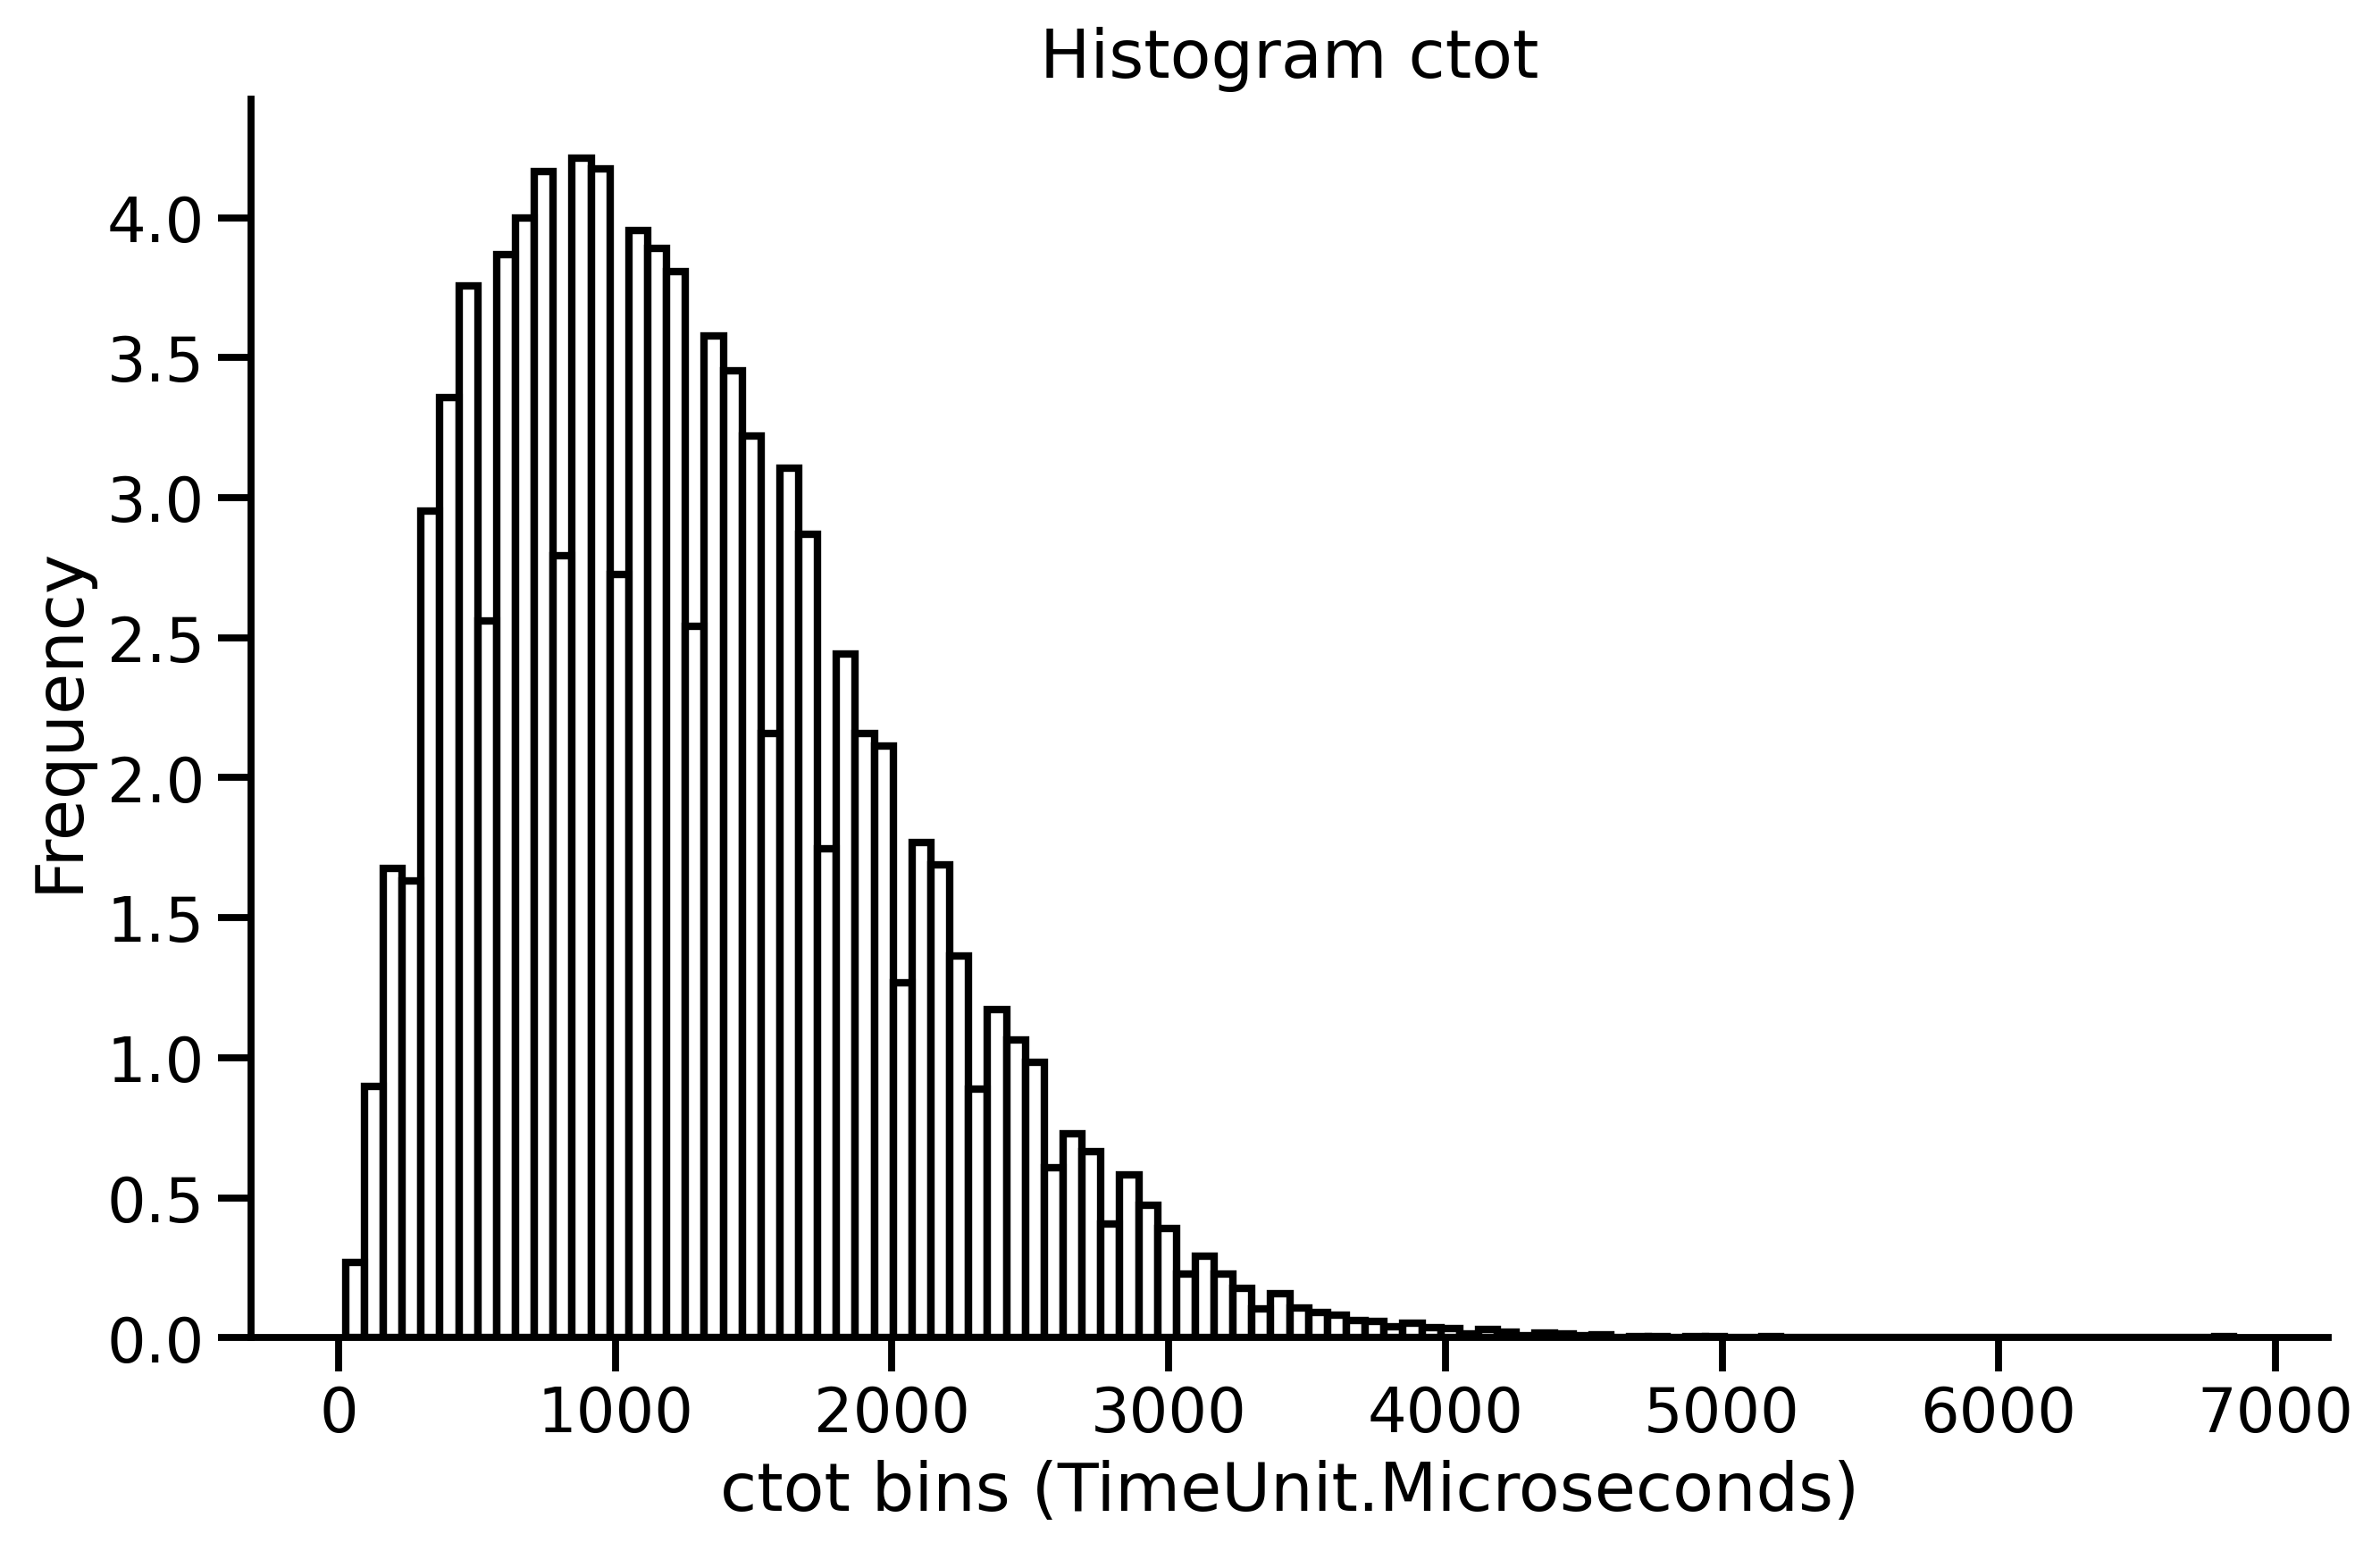
This example shows how to plot 1D histograms of parameters of interest. The example here shows the ToT distribution for pixel data and clusters data.
Luna Command
tpx3dump process -i /Users/Ciaran/atlassian-bitbucket-pipelines-runner/temp/e71169e4-520a-5b30-a5ab-ee8a44eb5fac/build/docs/source/_static/example_data.tpx3 -o /Users/Ciaran/atlassian-bitbucket-pipelines-runner/temp/e71169e4-520a-5b30-a5ab-ee8a44eb5fac/build/docs/source/_static/example_data.hdf5 --eps-t 150ns --eps-s 1 --ctot-cut 500
Python Script
Plot histograms
 1import os, sys
 2import h5py  # ensure you have `pip install h5py`
 3import pandas as pd  # ensure you have `pip install pandas`
 4from typing import *
 5import matplotlib.pyplot as plt
 6import seaborn as sns
 7import warnings
 8warnings.filterwarnings("ignore")  # suppress warnings from plotting libraries.
 9
10sns.set_context(context="talk")
11
12# add some paths to PYTHONPATH
13for directory in ["..", "."]:
14    sys.path.append(os.path.abspath(os.path.join(os.path.dirname(__file__), directory)))
15
16# on our system "EXAMPLE_DATA_HDF5" refers to the absolute path
17# to a hdf5 file generated by luna. Replace with your own!
18from env_vars_for_docs_examples import EXAMPLE_DATA_HDF5, PLOTS_DIRECTORY
19
20# re-use functions from previous example
21from ex2_read_data_time_units import load_clusters, TimeUnit, load_pixel_hits
22
23TOA_UNIT = TimeUnit.Microseconds
24
25
26def plot_1d_distribution(data: pd.DataFrame, variable: str, fname: str):
27    """
28    Plots the distribution of a specified variable from pixel or cluster data.
29
30    Args:
31        data (pd.DataFrame): DataFrame containing pixel or cluster data.
32        variable (str): The variable to plot the distribution of.
33    """
34    plt.figure(figsize=(10, 6))
35    sns.histplot(data[variable], bins=100, kde=False, color="white", stat="percent", edgecolor="black", linewidth=2)
36    sns.despine()
37    plt.title(f"Histogram {variable}")
38    plt.xlabel(f"{variable} bins ({TOA_UNIT})")
39    plt.ylabel(f"Frequency")
40    plt.savefig(fname, bbox_inches='tight', dpi=300)
41
42
43if __name__ == "__main__":
44    pixel_data: pd.DataFrame = load_pixel_hits(EXAMPLE_DATA_HDF5, toa_unit=TOA_UNIT)
45    cluster_data: pd.DataFrame = load_clusters(EXAMPLE_DATA_HDF5, toa_unit=TOA_UNIT)
46
47    base_name = "ex6_plot_distributions"
48    fname = os.path.join(PLOTS_DIRECTORY, base_name + f"_pixel_hit_tot.png")
49    plot_1d_distribution(data=pixel_data, variable="tot", fname=fname)
50
51    fname = os.path.join(PLOTS_DIRECTORY, base_name + f"_clusters_ctot.png")
52    plot_1d_distribution(data=cluster_data, variable="ctot", fname=fname)
Script Output
Example Output
hdf5 datasets: ['Clusters', 'ExposureTimeBoundaries', 'PixelHits', 'TimewalkLookupTable', 'TimewalkMatrix']